View Your Water Use
Our Customer Portal allows access to your account at any time. Along with setting usage alerts and paying your bill, you can view your annual, monthly, daily, and hourly water usage, or select a custom date range.

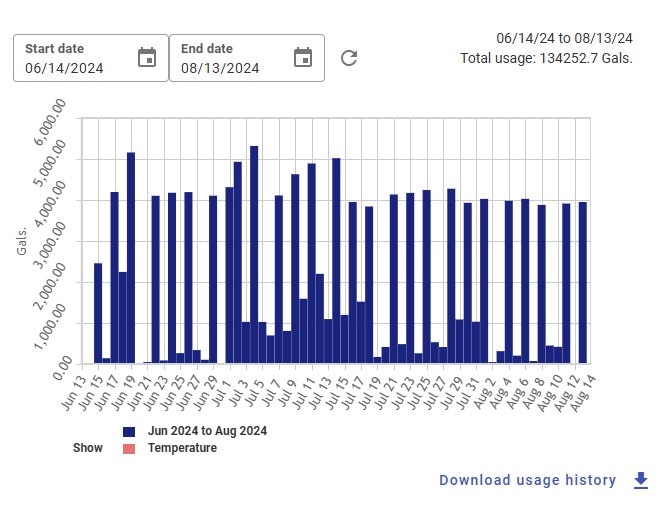
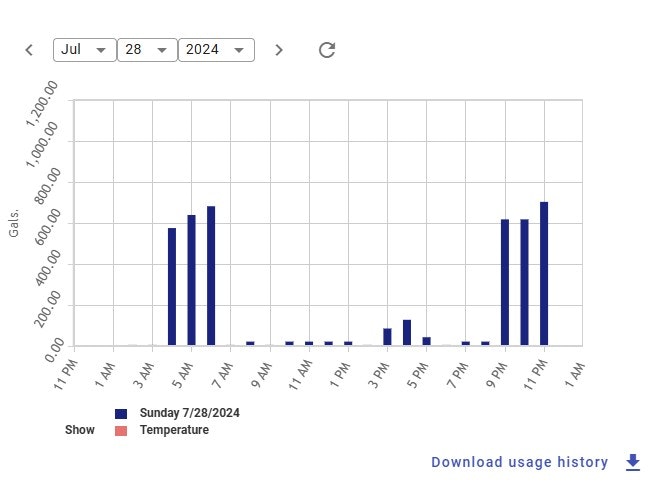
These graphs show the water meter data for a single-family home in our community. This property uses an irrigation system to water their yard. Just by looking at the graphs, we can see that most of this property’s water usage is for irrigation. These show that most water is used in regular patterns - during the morning and evening sprinkler times, on the allowed watering days, and only during the summer. The only time we would see this many gallons of water used at a house without irrigation is if there was an issue like a water leak.